#Brain dashboards are mobile and desktop dashboards built on DOMO Platform. The Mobile Dashboards are targeted towards on-the-go fast decision making. Employees from different geographies have secured access to their own dashboards. They provide a topline overview of KPI's across geographies for the leadership team to make business decisions. All the dashboards are updated on a daily frequency. They are custom coded on the DOMO Platform.
Mobile first dashboards can also be accessed via desktops for downloading the granular data for deep dive analysis. Also, some reports were designed for desktop specifically. They were targeted for analysis at a granular level. These are using the out of the box components of DOMO Platform.
Japan, China and other south east asian countries were existing when I joined the project. I helped the team to extend the design to the dashboards for United States, Travel Retail (TR), One China (China, Taiwan, HK), Global and a few shipment screens for Japan.
Markets 🌏
Background
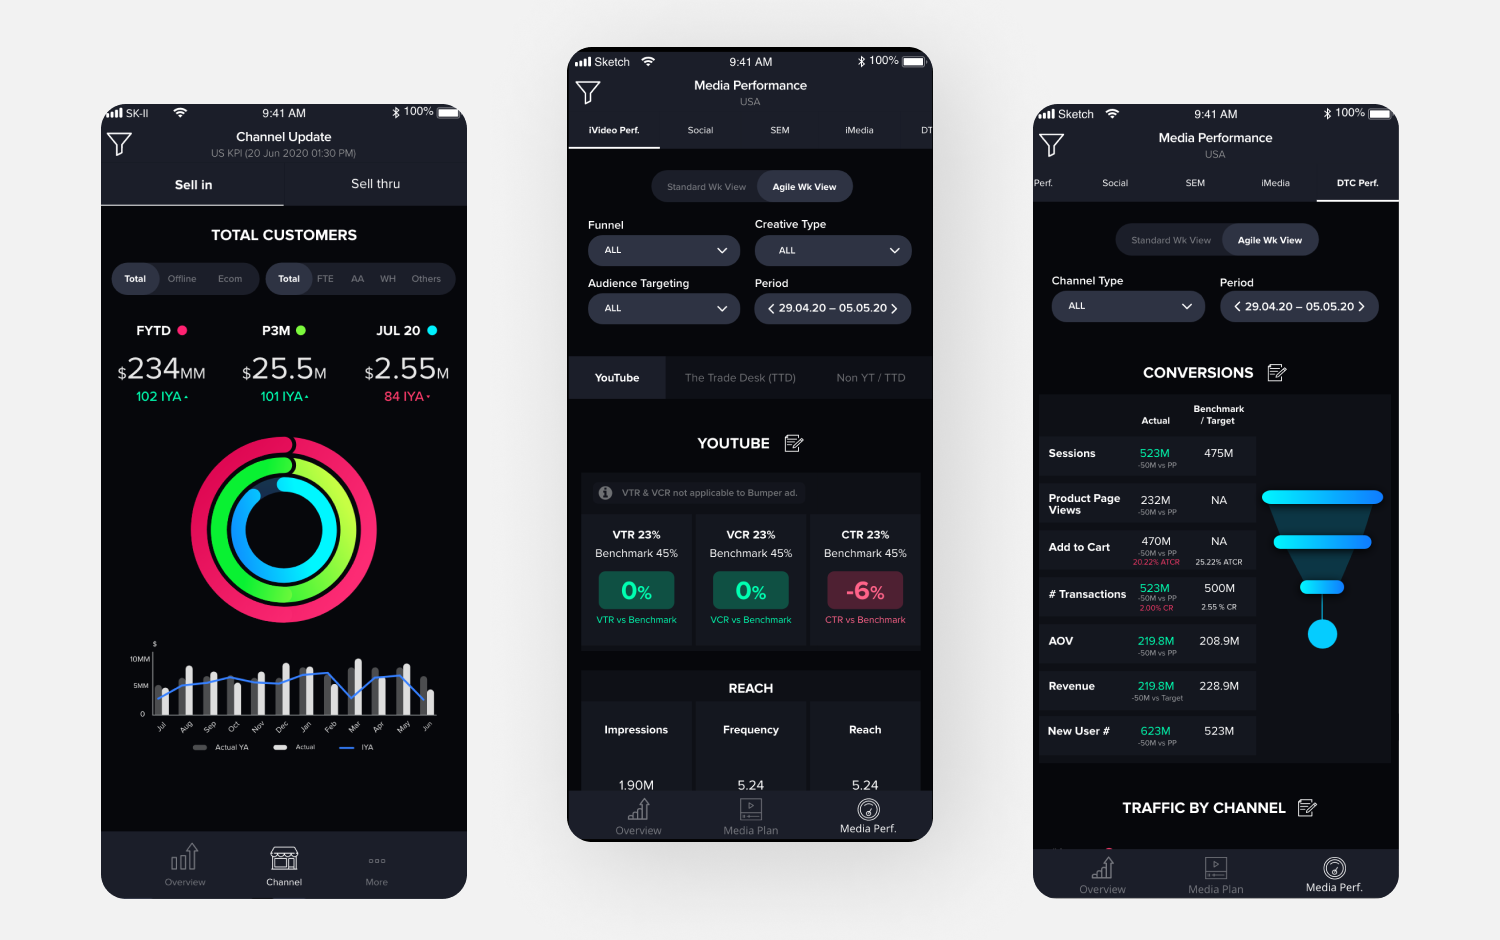
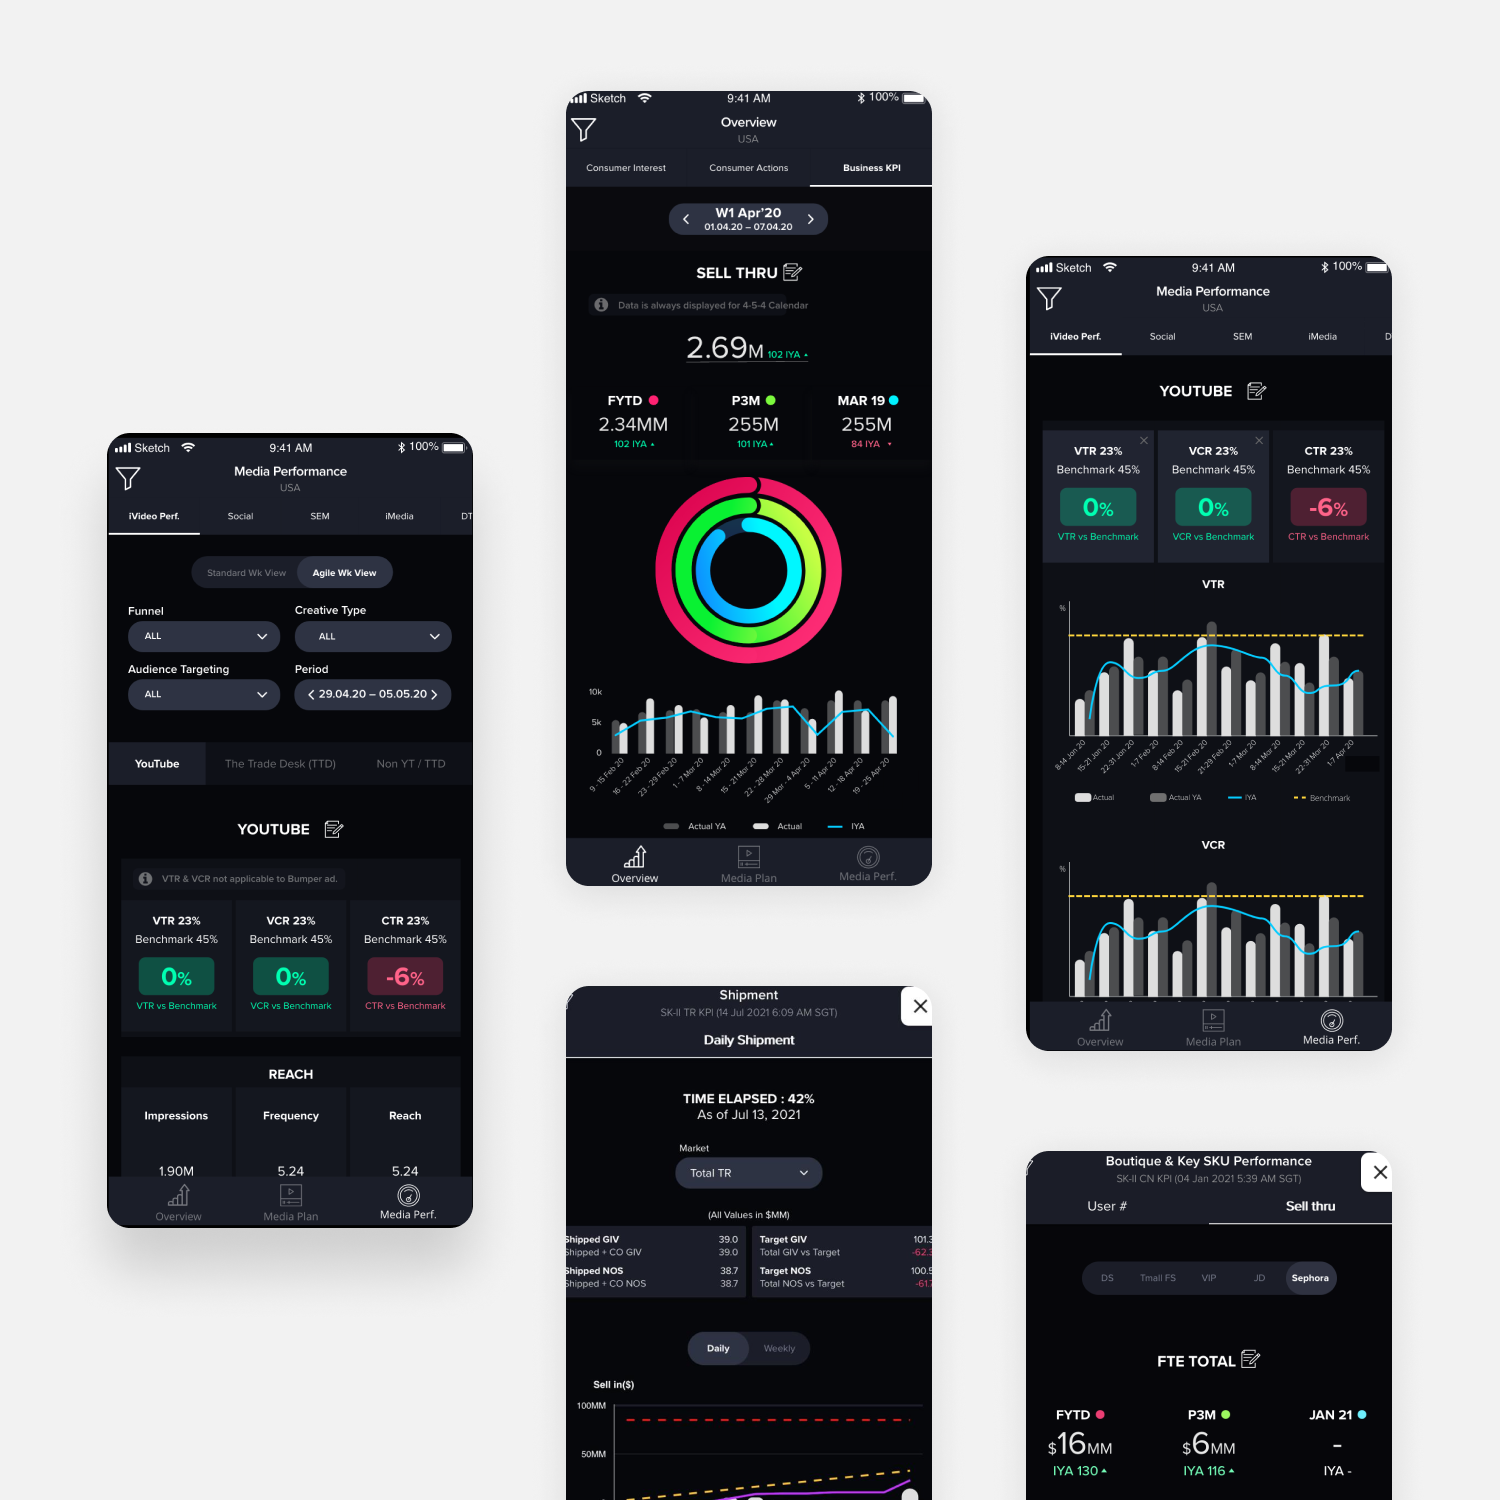
KPI Dashboards 📊
Created a custom mobile dashboard to view various KPI's in overview and by Channels. By Channel dashboard covered the business metrics displayed by customers. This dashboard was designed to view different customer performances and compare them. Also, as different customers follow varied business calendars in US, the design was modified to adopt and reflect comparable numbers. This project started in August 2020 and the dashboards were launched in December 2020.
Travel Retail project was more challenging as it covered many global markets together. This dashboard was created leveraging the existing components to view and compare different markets for fast business decisions. This project started in March 2021 and the dashboards were launched in November 2021.
The initial concept, user flows and user experience was created by an external agency prior to my joining the role. After joining in the role, I helped in expanding the dashboard to other markets US, One China, Travel Retail etc leveraging the existing style guide. Also, for some additional business requests, new components were designed like scrolling charts, multi-select filters, accordion market selections.
US - Media Dashboard 💻
Created a custom mobile dashboard to view the overview, Media Plan and Media Performance. More than 600 screens were designed to cater to different exceptions based on the Media platforms, assets, and Metrics to view the Media Performance.
This dashboard was designed to review every metrics in a timeline for past 12 weeks. Also, every asset’s individual performance can be tracked in this dashboard.
This project started in April 2020 and the dashboards were launched in September 2020 in different phases.
Commercial & Media Team have started to actively use both dashboards during
monthly and weekly meetings. Below are some feedbacks from the leadership team.
"The ability to see benchmark vs actuals is very helpful as thIs is not something that native platforms can do. Being able to see in one place performance across channels is definitely more efficient than switching from Google Ads, FB Business Manager etc!" - SK-II US Media Partner
"This has been extremely helpful since launch - it allows for a quick top-line view of the business, as well as a sufficient level of deep-dive when needed. Data extractions and visualisation seems a lot simpler and faster vs. before and its great to have accurate information available instantly." - SK-II US Sales Leader
"#Brain is a tremendous application to provide consistent data and reporting, I love how intuitive it is to use and so far find it very straightforward. I have seen many reporting systems implemented to organization and this is one of the few where we have heard little to none user issues and where almost 100% using regularly. I do look forward to future updates!" - SK-II US Sales Manager
Status ✈️
Applicable Markets - 11
KPI’s Captured - 150+
#Brain Users across Markets - 400+
Number of Dashboards - 200+
Adoption Rate - 97%